Climate Change and Visualization
Complicated scientific data are easier to comprehend when presented using a visual format. This module describes a new kind of visualization process that is being used to aid understanding of the potential impacts of climate change, and presents a number of examples of such visualizations. Scientific information is used to model what will happen under four different types of responses to climate change. The visualizations of these future scenarios effectively depict, to a range of stakeholders, the very different situations that are produced with differing actions to climate change. As such, they are very useful in climate change planning and communication relating to land management and urban planning.
Learning Objectives
After viewing the module presentations and laboratory videos, users should be able to:
- Describe what is meant by visualization.
- Explain how visualization can be used to communicate information about climate change.
- Describe the types of and sources for input data used to make visualizations.
- Identify various types of responses to the issue of climate change and corresponding actions to address potential effects of climate change that are used in modeling future scenarios.
- Explain the key stages of the visioning process.
- Describe, using examples, the very different pictures that are produced according to the choices we make about (reaction to) climate change.
- Explain, using examples, how visualizations can be used to improve the public participation and learning process.
- Describe the results from research on the effectiveness of visualizations in communicating impact of climate change.
Presenter
Listen to Dr. Sheppard respond to the question: How did I get interested in this area of study? by clicking on his photo.
For information about Dr. Sheppard, please check UBC, Faculty of Forestry
Module Resources
Presentation
Visualization Climate Change Planning and Communication
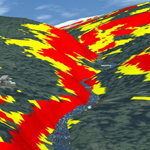
Dr. Stephen Sheppard discusses how the production of visualizations is carried out in consultation with local community groups. The key stages of visualization projects are: organizing of community working groups, collection of data, 2-D mapping and input of this to 3-D visualizing program, computer generation of scenarios, community information sharing, and potentially, changing of policies. Project examples discussed here are impacts of climate change on winter snow pack and fire risk hazard in Vancouver’s North shore mountains, and response options regarding ocean level rise in Delta, a community near Vancouver.
Other Resources
Sheppard, S.K.J. 2012. Visualizing Climate Change: A Guide to Visual Communication of Climate Change and Developing Local Solutions. Earthscan, Abingdon, U.K.
Collaborative for Advanced Landscape Planning
Potential Questions for use by Instructors
- Explain, using at least two examples from the presentation, how the visualizations can be used to communicate key information regarding how climate change may affect land use planning at the urban forest interface.
- Why are the community visioning sessions important? What can be learnt by communities through utilization of these visualizations? What are some of the general results found in research in the impact of visioning?

